Visualize functions
You can visualize any non-discrete function in BOCoDe. This is useful for understanding the function’s behavior, landscape characteristics, and potential optimization challenges.
Example Usage
import bocode

# Initialize the function
problem = bocode.Synthetics.Powell()

# Visualize the function
problem.visualize_function()
Example Output at http://127.0.0.1:8050/:
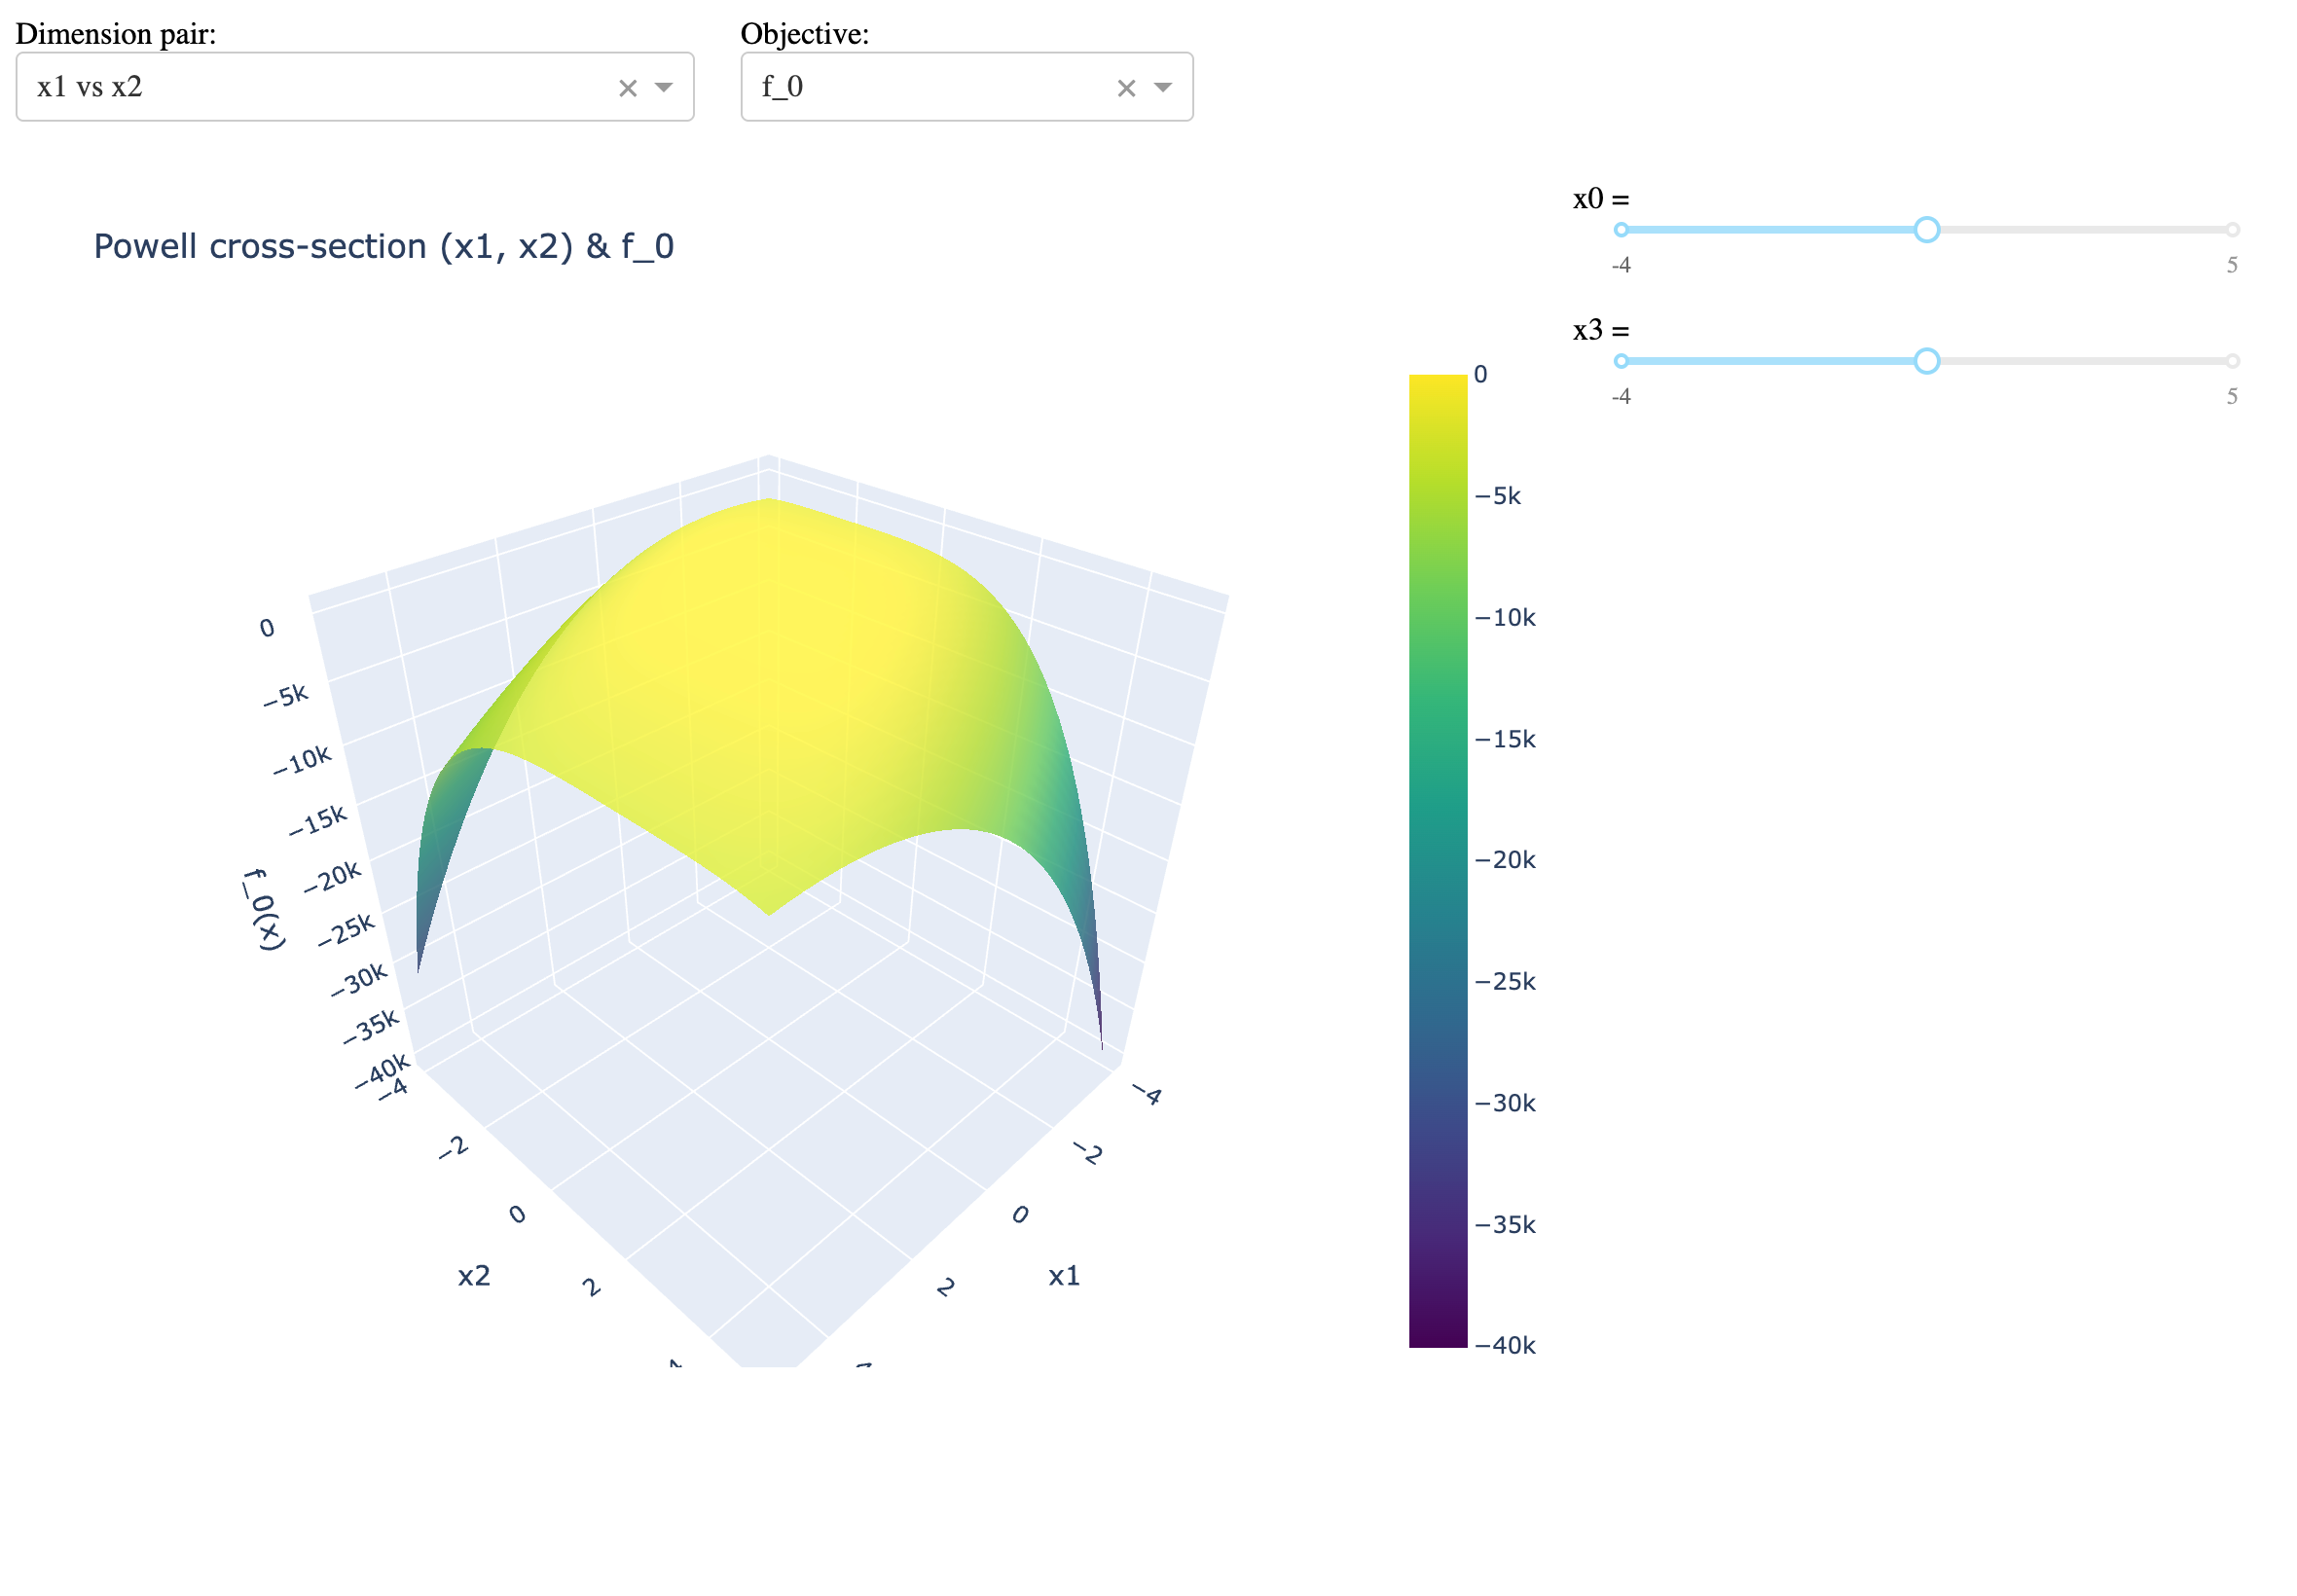
Visualization Features
1D problems: 2D line plots for each objective
2D problems: 3D surface plots for each objective
Higher dimensions: Interactive cross-sectional 3D plots with sliders for fixed dimensions
Note
Visualization is not supported for discrete or mixed variable types. For high-dimensional problems, the visualization may be slow due to computational requirements. Any crashes that occur during visualization generation are likely due to memory insufficiencies.